| Fentanyl Deaths More Than Doubled in 30 States in Just Two Years Fentanyl Deaths Among Teens Tripled, Deaths Among Black Teens Increased 5x New Report: https://familiesagainstfentanyl.org/states/Akron, Ohio – In just two years, fentanyl poisoning deaths have doubled in the United States, and in 30 states, deaths have more than doubled according to a new analysis from Families Against Fentanyl. In six states, fentanyl fatalities increased nearly fivefold (Alaska, Colorado, Louisiana, Mississippi, California and Texas). See the report, “Fentanyl: The State We’re In” and tables at end of release below. Families Against Fentanyl also found that among teens, fentanyl poisoning deaths are rising even faster. Teen deaths tripled in the last two years, and among black teens, deaths are five times higher than they were two years ago. Families Against Fentanyl analyzed data from the Center for Disease Control to find where and among which groups fentanyl poisoning deaths are rising the fastest. 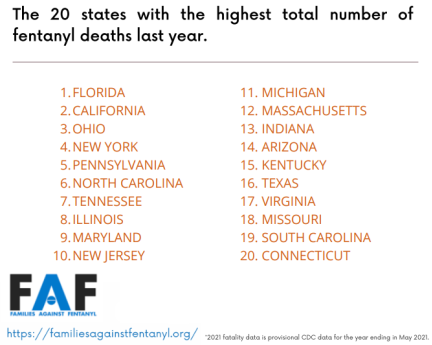 Since 2015, fentanyl fatalities across the United States increased by 547%. In Indiana, the District of Columbia, Minnesota, Washington and Colorado - fentanyl fatalities increased by over 1,000%. In Louisiana, Arizona and California - they increased by more than 2,000%.“The fentanyl crisis is getting worse, not better. Fake pills with deadly amounts of fentanyl are popping up everywhere. It’s in fake Xanax and Percocets, it’s being laced in cocaine and ecstasy. A single pill can kill,” said Families Against Fentanyl founder James Rauh, who lost his son to fentanyl poisoning.“Fentanyl poisoning is tearing families apart and killing our young people at an alarming rate. This stuff is so deadly it’s been used as a chemical weapon. Even babies and young children have been fatally poisoned by accident. It does not belong on our streets. It’s time for our leaders in Washington to do more.” “It is time to attack fentanyl overdoses with the same vigor and approaches as we do the coronavirus. It is heartbreaking to treat babies who overdosed or people who had no idea their pills or powder was contaminated with a deadly poison,” said Dr. Roneet Lev, emergency physician and former Chief Medical Officer of the White House Office of National Drug Control Policy. “Treating fentanyl overdoses is an attempt to bring someone back from the dead. As an emergency physician I do my best, but sadly we are not always successful. Fentanyl suppliers are preying on the vulnerable in our society.” Families Against Fentanyl is a non-profit organization dedicated to raising awareness of the illicit fentanyl crisis and advocating for federal action. The organization was founded by James Rauh of Akron, Ohio after his son was killed by fentanyl poisoning in 2015. Today’s analysis comes on the heels of another recent report from Families Against Fentanyl that found that fentanyl poisoning is now the #1 cause of death among Americans 18-45 and was responsible for more deaths than suicide, car accidents or gun violence last year. The new report also follows a new report published in JAMA Pediatrics that found that unintentional drug “overdose” deaths among Americans aged 10-24 years old have resulted in the loss of 1.25 million years of life from 2015 through 2019.“Mass incarceration of drug users and low-level dealers is not the answer and won’t stop the poisoning. We need to go to the source and stop the illegal manufacturers of this lethal chemical. Almost all illicit fentanyl is manufactured in other countries. By designating fentanyl a Weapon of Mass Destruction, the U.S. can do more to root out the illegal manufacturers and stop this poison before it ever reaches our streets. If 200,000 deaths isn’t mass destruction, I don’t know what is,” added Rauh. Since 2015, fentanyl fatalities across the United States increased by 547%. In Indiana, the District of Columbia, Minnesota, Washington and Colorado - fentanyl fatalities increased by over 1,000%. In Louisiana, Arizona and California - they increased by more than 2,000%.“The fentanyl crisis is getting worse, not better. Fake pills with deadly amounts of fentanyl are popping up everywhere. It’s in fake Xanax and Percocets, it’s being laced in cocaine and ecstasy. A single pill can kill,” said Families Against Fentanyl founder James Rauh, who lost his son to fentanyl poisoning.“Fentanyl poisoning is tearing families apart and killing our young people at an alarming rate. This stuff is so deadly it’s been used as a chemical weapon. Even babies and young children have been fatally poisoned by accident. It does not belong on our streets. It’s time for our leaders in Washington to do more.” “It is time to attack fentanyl overdoses with the same vigor and approaches as we do the coronavirus. It is heartbreaking to treat babies who overdosed or people who had no idea their pills or powder was contaminated with a deadly poison,” said Dr. Roneet Lev, emergency physician and former Chief Medical Officer of the White House Office of National Drug Control Policy. “Treating fentanyl overdoses is an attempt to bring someone back from the dead. As an emergency physician I do my best, but sadly we are not always successful. Fentanyl suppliers are preying on the vulnerable in our society.” Families Against Fentanyl is a non-profit organization dedicated to raising awareness of the illicit fentanyl crisis and advocating for federal action. The organization was founded by James Rauh of Akron, Ohio after his son was killed by fentanyl poisoning in 2015. Today’s analysis comes on the heels of another recent report from Families Against Fentanyl that found that fentanyl poisoning is now the #1 cause of death among Americans 18-45 and was responsible for more deaths than suicide, car accidents or gun violence last year. The new report also follows a new report published in JAMA Pediatrics that found that unintentional drug “overdose” deaths among Americans aged 10-24 years old have resulted in the loss of 1.25 million years of life from 2015 through 2019.“Mass incarceration of drug users and low-level dealers is not the answer and won’t stop the poisoning. We need to go to the source and stop the illegal manufacturers of this lethal chemical. Almost all illicit fentanyl is manufactured in other countries. By designating fentanyl a Weapon of Mass Destruction, the U.S. can do more to root out the illegal manufacturers and stop this poison before it ever reaches our streets. If 200,000 deaths isn’t mass destruction, I don’t know what is,” added Rauh.Bipartisan leaders including former Homeland Security Secretary Tom Ridge and former CIA Director John Brennan have joined with Families Against Fentanyl towarn of the national security threat posed by illicit fentanyl and urged President Biden to designate illicit fentanyl and its analogues as weapons of mass destruction. More than 25,000 Americans have joined the call by signing FAF's petition. See tables below. Full report is available at: https://familiesagainstfentanyl.org/states/ Media contact for questions and interviews: Press@familiesagainstfentanyl.org 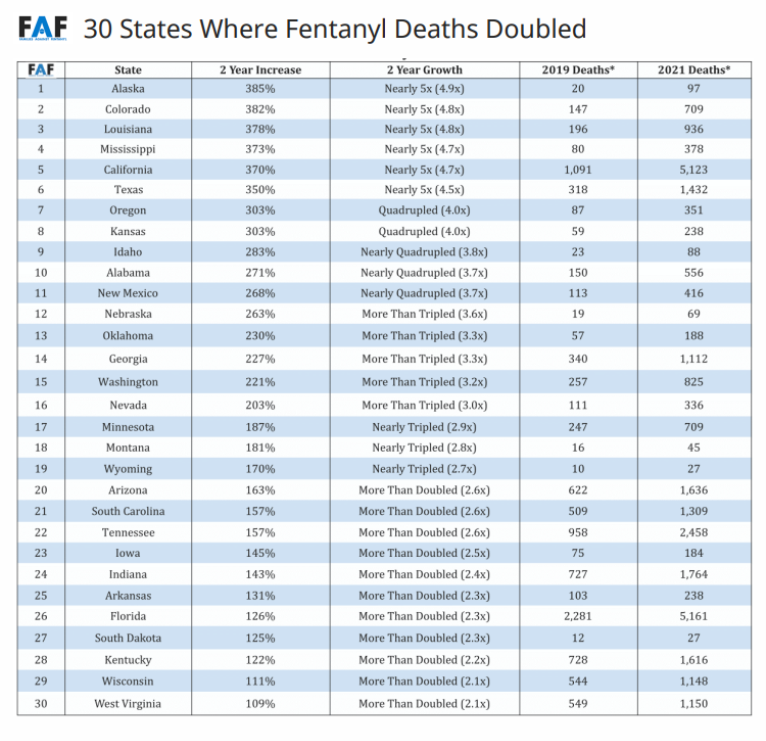 Technical note: This analysis was calculated using the most recent reliable data per CDC recommendations and compares fatalities for the 12 month period ending in May 2021 to the 12 month period ending in May 2019. Highest Fentanyl Deaths Per Capita In Last YearPer Capita RankStateDeath RateTotal Deaths*Total Deaths Rank1West Virginia64.41,150212District of Columbia49.7354333Maryland402,42094Delaware38.1376325Ohio374,29936Kentucky36.11,616157Tennessee35.72,45878Connecticut331,174209Maine30.64133010Rhode Island29.23093611Pennsylvania28.93,690512Massachusetts28.61,9751213Vermont26.81674314Indiana26.11,7641315New Jersey25.62,2761016South Carolina25.11,3091917North Carolina242,543618Florida23.75,161119Arizona221,6361420New Hampshire21.92993721Missouri21.71,3341822Michigan20.52,0471123New York20.23,912424Louisiana20.19362425New Mexico19.84162926Wisconsin201,1482227Illinois19.42,442828Virginia15.81,3571729Alaska13.3974430California135,123231Mississippi12.73783132Minnesota12.57092633Colorado12.27092734Alabama11.35562835Washington10.78252536Nevada10.73363537Georgia10.41,1122338Oregon8.33513439Kansas8.22383840Arkansas7.92383941North Dakota6.8524742Iowa5.81844143Utah5.21704244Texas4.91,4321645Idaho4.8884546Oklahoma4.71884047Wyoming4.6275048Montana4.2454849Nebraska3.6694650South Dakota3275151Hawaii2.33349 Technical note: This analysis was calculated using the most recent 12 months of reliable provisional data per CDC recommendations and which at time of analysis is the 12 month period ending in May 2021. |
February 5th, 2022
// Fentanyl Deaths More Than Doubled in 30 States in Just Two Years
TRAIN IT RIGHT NEWSLETTER
Sign Up and get a free 7 day Train it Right HIIT Program!